04.2 / calculator
◆ shipped · production
Open-Architecture Calculator
A self-service fund-reallocation calculator that pulled IMO product clients out of long support calls and gave them the tools to model scenarios themselves, integrated with live NYSE market data.
- Role
- Senior UX Designer · Group 1001 · 6 months
- Stack
- Stakeholder researchInformation architectureData visualizationProgressive disclosureNYSE market data integrationActuarial collaboration
◆ problem
Every fund reallocation required a long support phone call. Significant annual support cost just for calculations. No way for clients to model scenarios independently.
◆ solution
Self-service calculator with progressive complexity, embedded learning, and live NYSE market awareness. Integrated with rate systems and contract databases.
◆ impact
Eliminated the phone-call dependency for routine reallocation. Increased assets under management, improved retention, and freed agent capacity for advisory.
§01 · problem
Every fund reallocation required a long phone call.
IMO product clients had to call support every time they wanted to explore fund reallocation. The bottleneck was expensive on every axis: heavy annual support cost, limited client access, no ability to model scenarios independently.
- repeat calls · most reallocation inquiries required multiple phone conversations to resolve.
- long calls · complex calculations regularly turned into half-hour-plus support sessions.
- abandonment · process complexity drove a meaningful share of inquiries to drop off before resolution.
- cost · the support load for calculations alone consumed a substantial annual budget.
Underneath the cost: a financial-literacy gap. Clients couldn't evaluate reallocation decisions without guided context, and the phone channel didn't scale the kind of explanation they needed.
§02 · users
IMO product clients making financial decisions.
IMO (independently managed offering) product clients weighing fund reallocation against market conditions and contract constraints. Sophisticated enough to want the tools, often not sophisticated enough to use them without guardrails.
§03 · process
24-week build with actuaries, engineers, legal, and product.
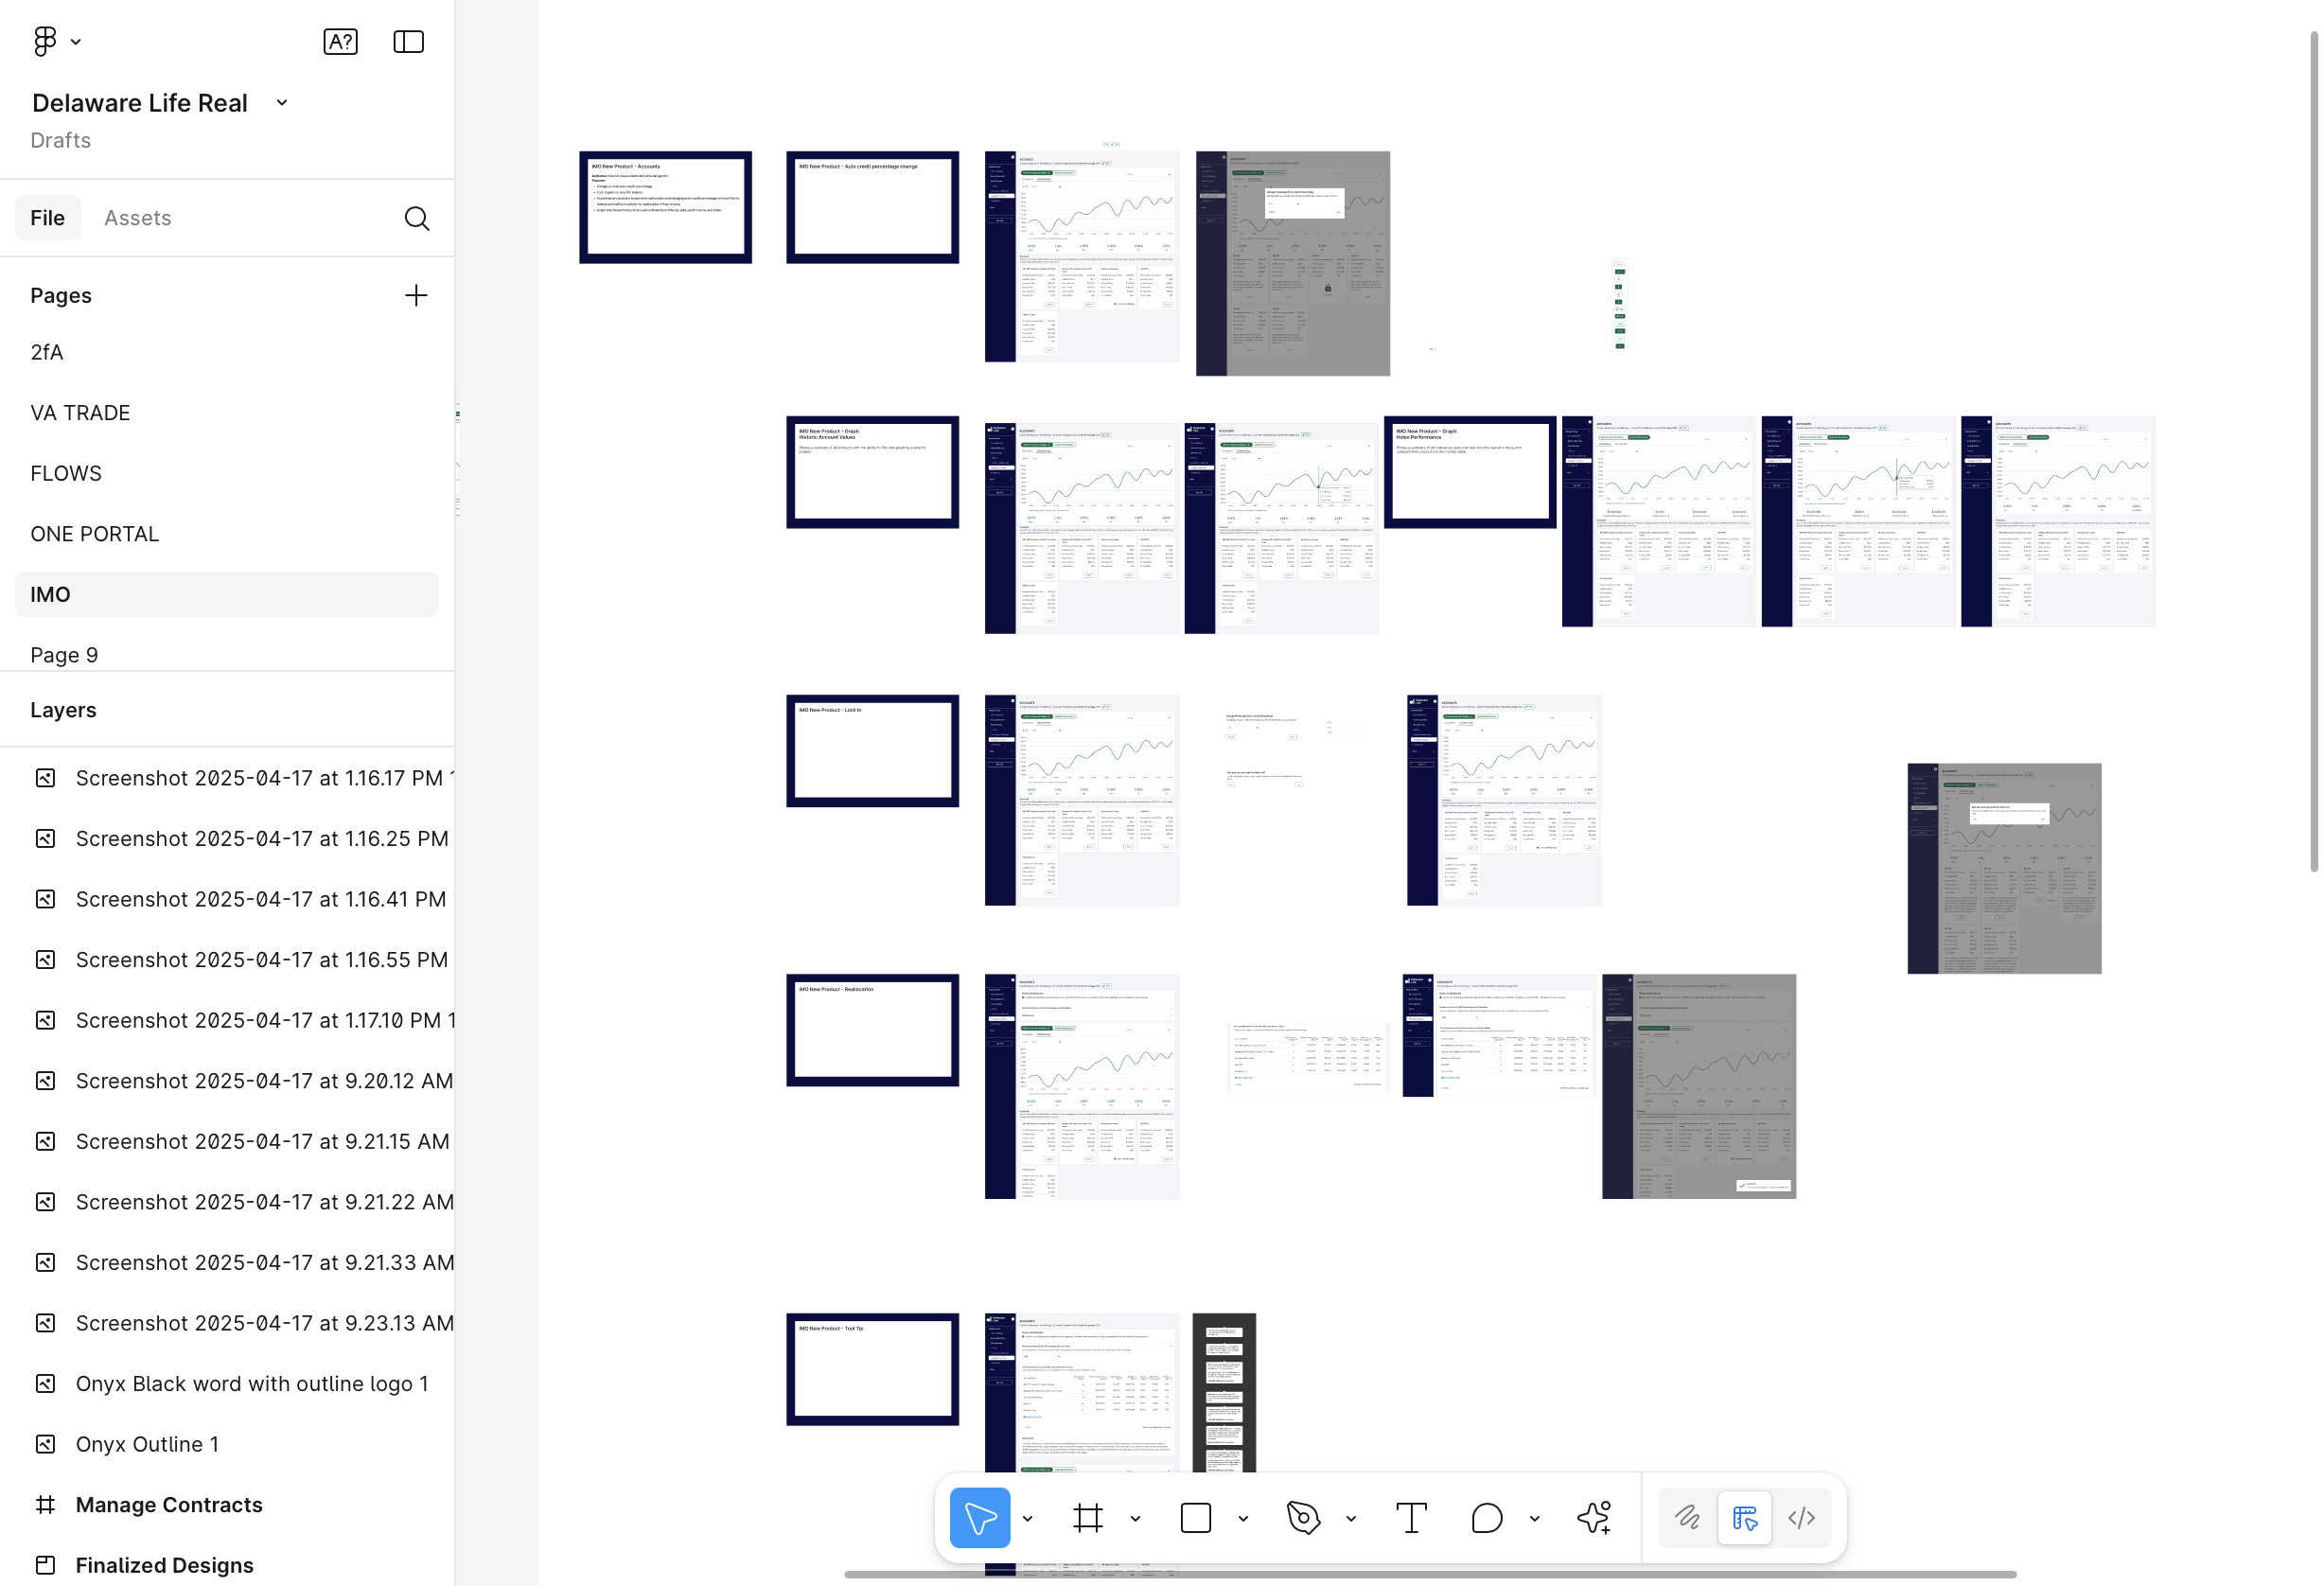
Cross-functional collaboration across product, two engineers, a data analyst, the actuarial team, and legal.
- research (4 weeks) · stakeholder interviews with support agents, PMs, actuaries, clients. Call-center data analysis.
- information architecture (6 weeks) · flows accommodating NYSE market constraints; collaboration with actuaries on calculation accuracy.
- visual design (6 weeks) · professional interfaces that instill confidence in financial decisions; data viz for complex projections.
- user testing (4 weeks) · interactive prototypes with real client data; moderated sessions with existing IMO clients.
- implementation (4 weeks) · actuarial calculations + real-time NYSE feeds + rate systems + contracts + auth integration.
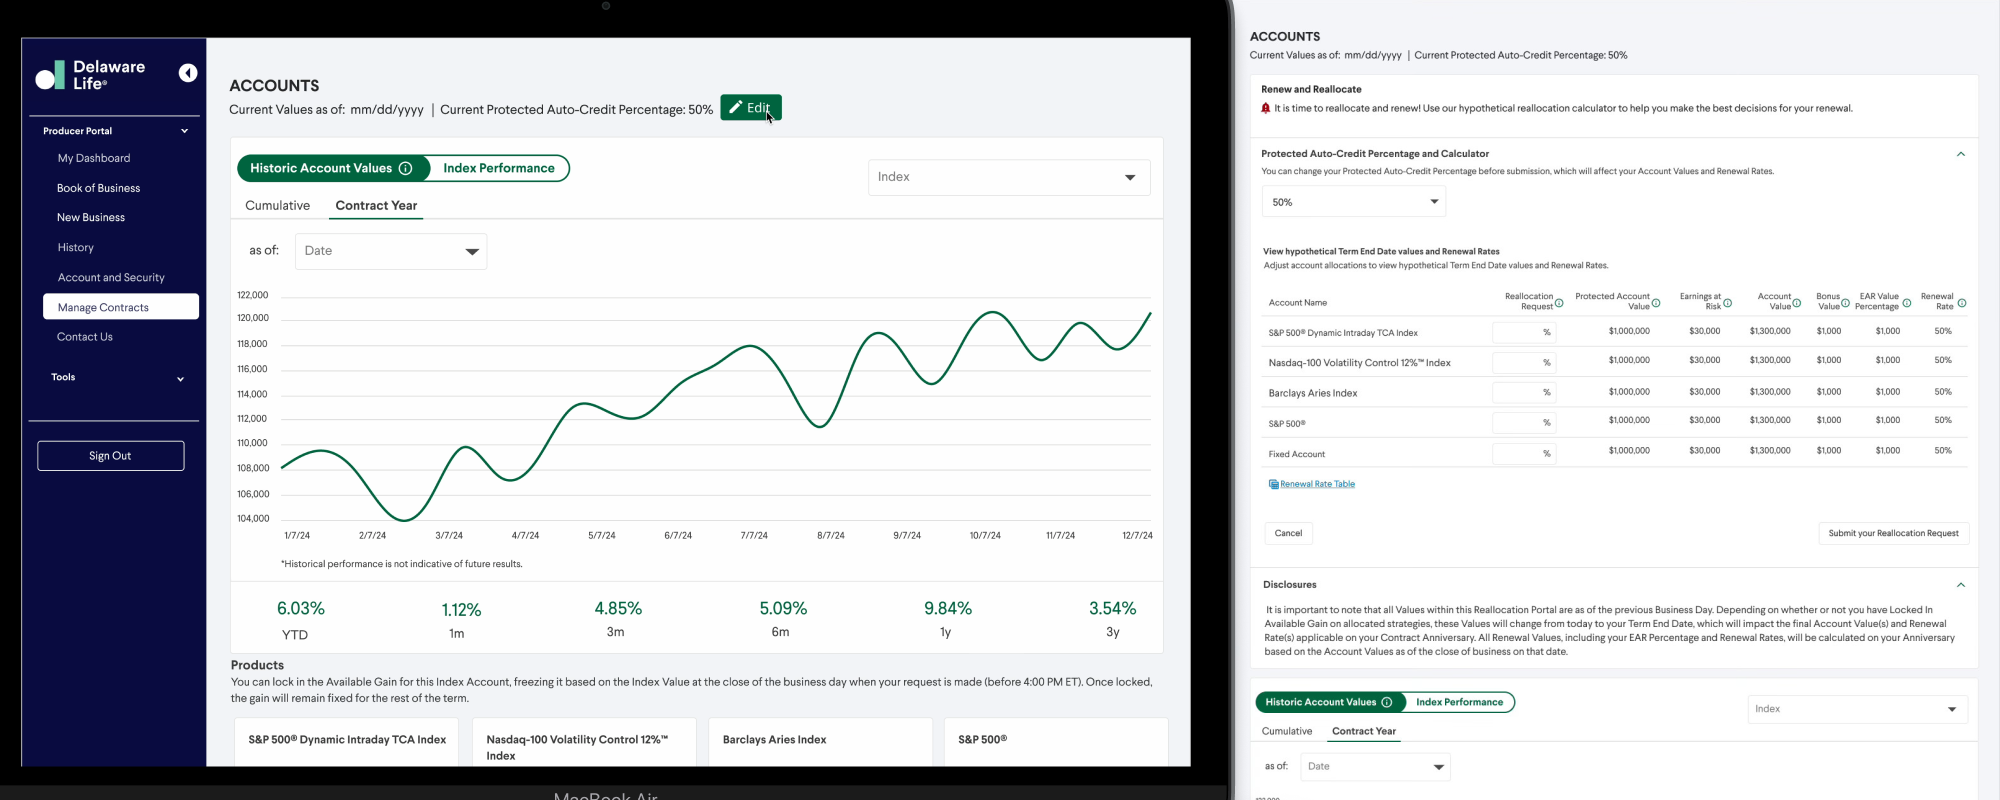
§04 · solution
Progressive complexity. Embedded learning. Live market awareness.
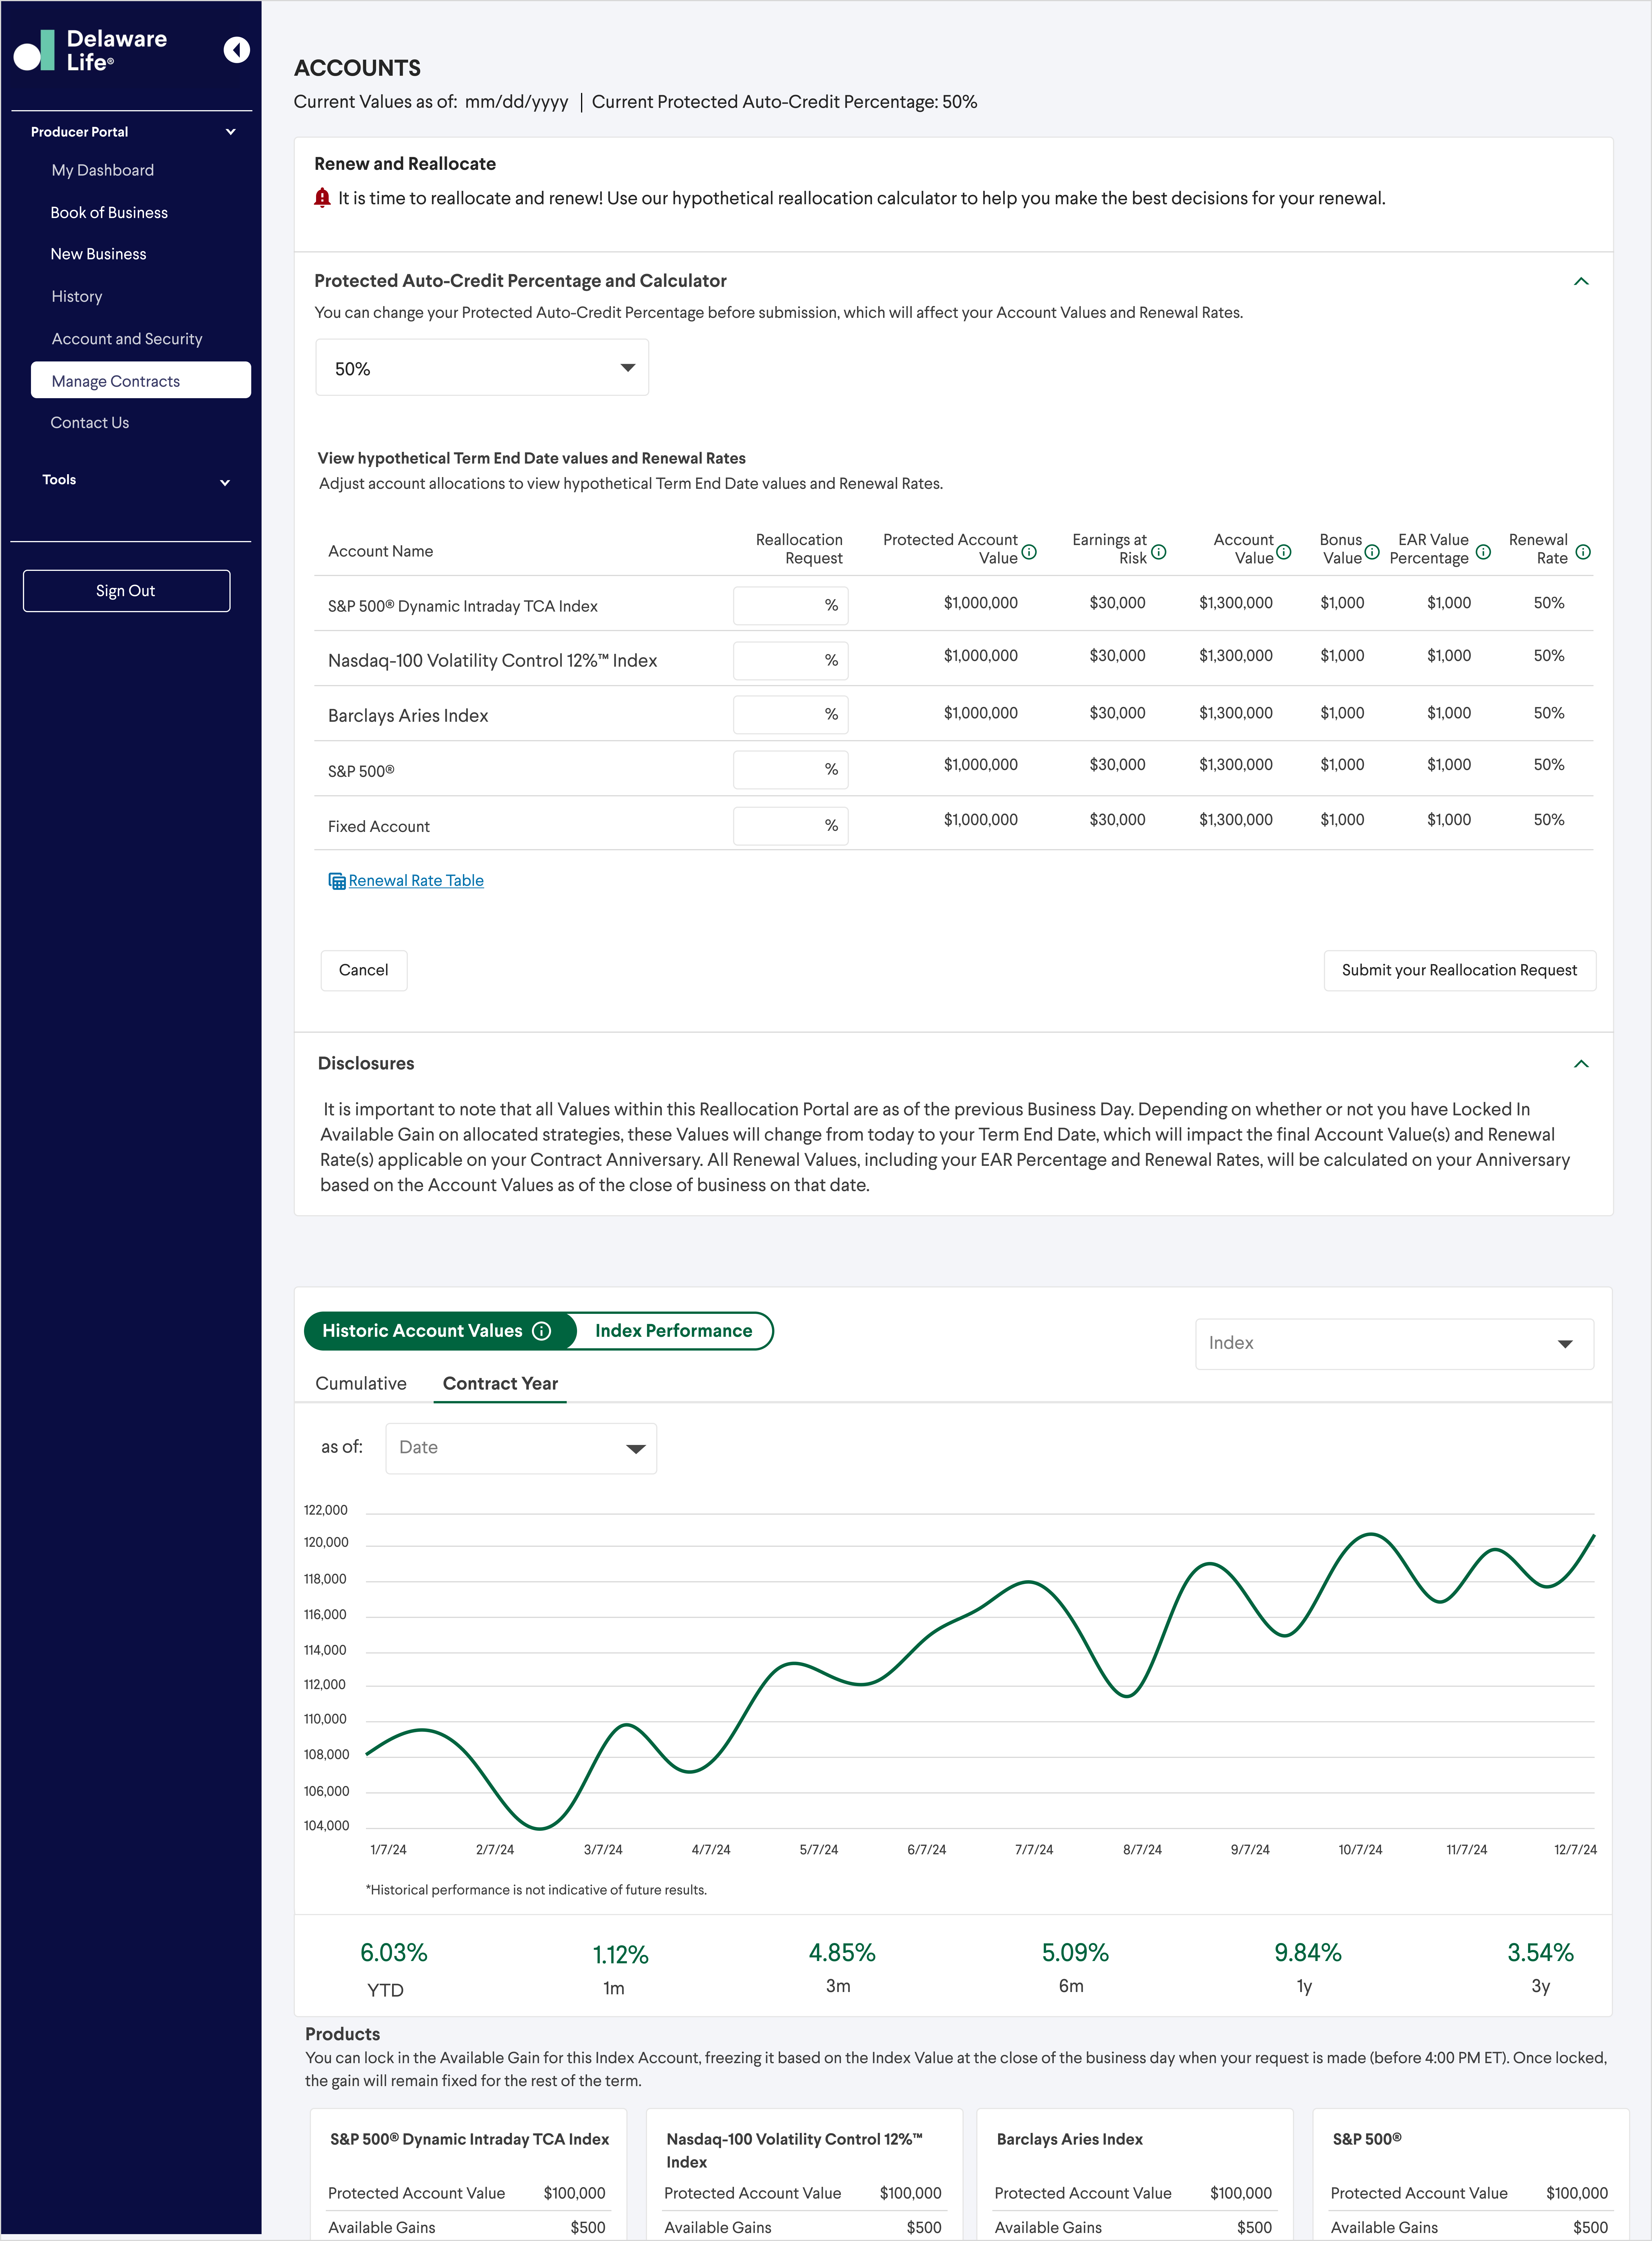
- progressive complexity · starts simple, reveals complexity gradually so users meet the interface at their comfort level.
- integrated learning · contextual tooltips, inline definitions, and just-in-time tutorials embedded directly in the calculation workflow.
- market-aware UX · interface communicates market timing constraints in real time and gracefully handles after-hours scenarios with next-day scheduling.
- self-service rate locking · with market-aware expiration timelines.
- ecosystem integration · fluid navigation between calculations, contracts, and the rest of the IMO platform.
§05 · outcomes
Self-service in minutes, not phone calls in hours.
- Most clients now complete reallocation calculations independently, with the embedded learning layer bridging the financial-literacy gap.
- Average time-to-complete dropped from a long multi-call interaction to a short self-service session.
- Basic terminology questions to agents fell sharply, shifting agent time toward complex advisory work.
- Assets under management grew as reallocation friction decreased.
- Client retention improved measurably after launch.
- Agent availability for complex advisory services increased as the self-service path absorbed routine cases.